TL;DR:
- Technical analysis in crypto relies on historical price and volume data to predict future movements.
- Its effectiveness is higher in trending markets but limited by lagging signals and false breakouts.
- Combining TA with risk management, on-chain data, and AI tools improves trading accuracy and discipline.
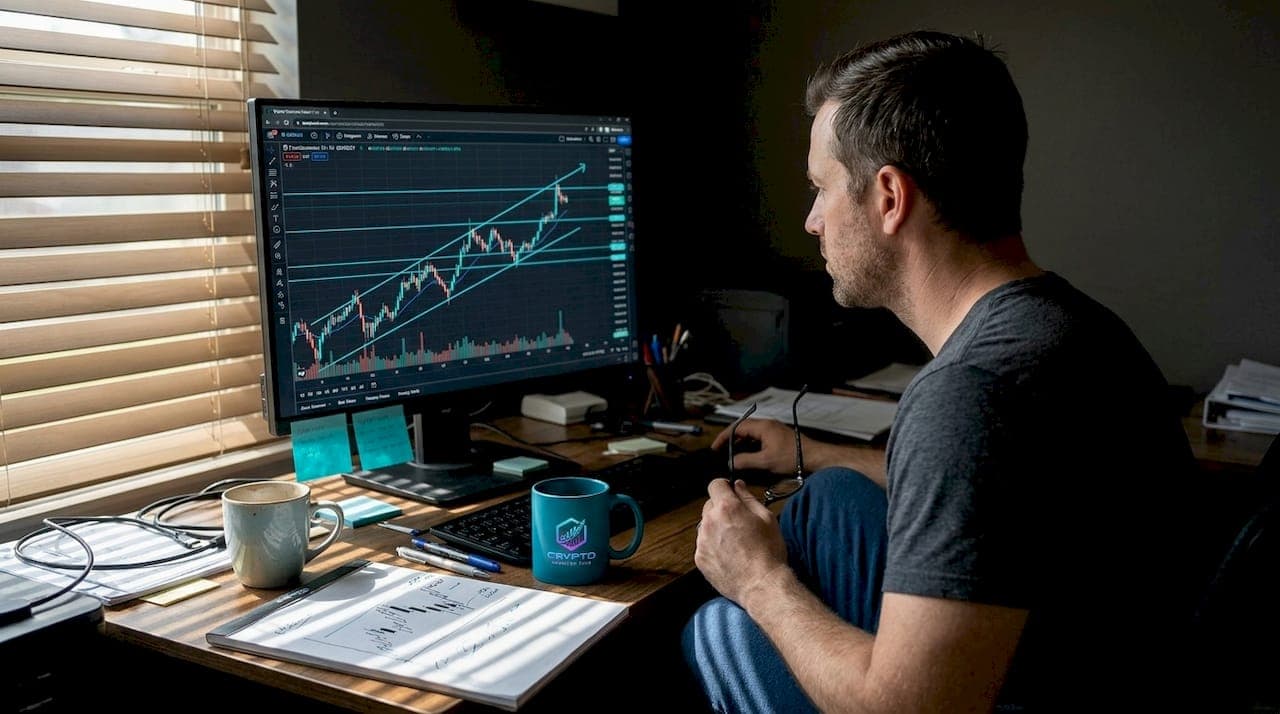
Technical analysis in crypto is not about drawing random lines on a chart. It is a disciplined, data-driven practice built on historical price action and volume patterns to forecast where markets may move next. For traders navigating Bitcoin's 10% overnight swings or altcoin pumps driven by sentiment shifts, understanding TA is not optional. It is the difference between reacting emotionally and trading with structure. This guide breaks down everything you need to know, from core concepts and indicators to real strengths, hidden weaknesses, and actionable strategies you can apply today.
Table of Contents
- What is technical analysis in crypto?
- Core methods: Patterns, indicators, and price action
- Strengths and weaknesses of technical analysis in crypto
- Best practices for using technical analysis in crypto trading
- Our perspective: Technical analysis in crypto—what most traders get wrong
- Enhance your crypto trading with advanced tools
- Frequently asked questions
Key Takeaways
| Point | Details |
|---|---|
| TA analyzes price and volume | Crypto technical analysis studies past market data to forecast price direction. |
| Combining tools boosts accuracy | Using several TA indicators and confluence increases reliability over single methods. |
| Risk management is essential | Limiting losses and setting stop losses greatly improves trading longevity. |
| TA offers probabilities, not guarantees | No method is perfect—use TA to spot likely setups, not certainties. |
| AI can enhance TA returns | Machine learning and trend strategies can further improve trading outcomes. |
What is technical analysis in crypto?
Technical analysis (TA) is the practice of studying past market data, primarily price and volume, to make educated predictions about future price movement. The core assumption is straightforward: all known information is already reflected in the current price. That means instead of analyzing a project's team, whitepaper, or tokenomics (which falls under fundamental analysis), TA focuses purely on what the chart is telling you right now.
This matters enormously in crypto because most retail traders cannot access the deep on-chain research tools or venture-level data that institutional players use. Charts level the playing field. Every trader sees the same price action, the same candlestick formations, and the same volume spikes.
"Technical analysis provides a framework for understanding market behavior through price patterns and historical data, giving structure to what otherwise looks like chaos."
Here is what the building blocks of crypto TA look like in practice:
- Trends: The overall direction of price movement, either upward (bullish), downward (bearish), or sideways (ranging).
- Support and resistance: Price levels where buying or selling pressure tends to cluster, causing bounces or reversals.
- Chart patterns: Recognizable formations like triangles, flags, and head-and-shoulders that suggest likely next moves.
- Volume: The number of coins traded in a given period, used to confirm whether a price move has conviction behind it.
Unlike fundamental analysis, TA does not ask whether a coin is "worth" buying long-term. It asks: given where price has been, where is it most likely to go next? That is why crypto technical analysis methods and AI market analysis for crypto have both become essential research layers for modern traders. The chart is not opinion. It is behavior made visible.
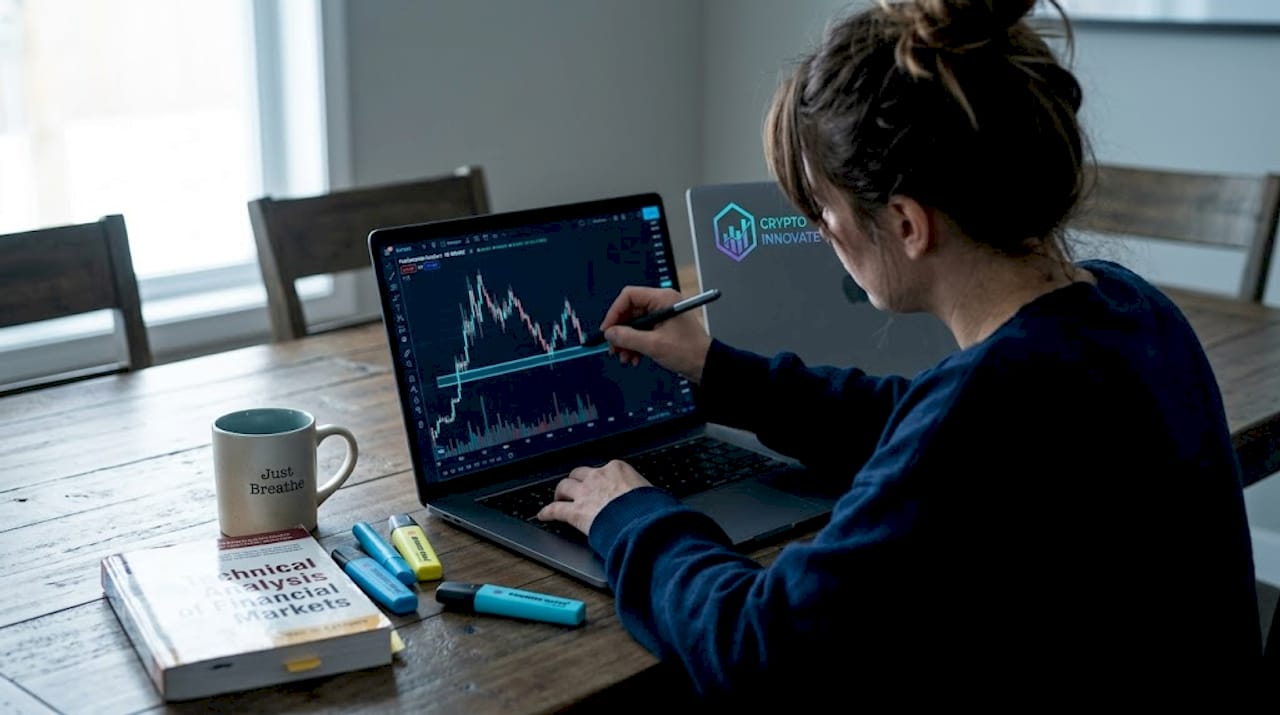
Core methods: Patterns, indicators, and price action
Now that the foundation is set, it helps to understand the specific tools that make TA work. There are more indicators than any one trader could ever use, so the goal is knowing which ones are worth your attention and why.
Chart patterns and price action
Chart patterns show reliability of up to 80% when confirmed by volume and context. Head-and-shoulders patterns signal trend reversals. Double tops and double bottoms suggest exhaustion at key price levels. Flags and pennants indicate brief consolidation within a strong trend before continuation. Price action, which is the raw study of candlestick movements without indicators, remains one of the most respected tools among professional traders because it requires no lag and no additional computation.
Popular indicators worth knowing
The most widely used crypto market indicators include Moving Averages, RSI, MACD, and Bollinger Bands. Here is how they compare:
| Indicator | What it measures | Best used for |
|---|---|---|
| Moving Average (MA) | Average price over a set period | Identifying trend direction |
| RSI (Relative Strength Index) | Momentum and overbought/oversold zones | Spotting reversals |
| MACD | Momentum shifts via moving average crossovers | Trend and momentum confirmation |
| Bollinger Bands | Price volatility relative to a moving average | Breakout and squeeze setups |
| Volume | Total trading activity in a period | Validating breakouts or breakdowns |
According to volume and MA research, RSI divergences and 50/200 moving average crossovers are among the most closely watched signals in crypto trading. When the 50-day MA crosses above the 200-day MA, it is commonly called a "golden cross," and it has historically preceded strong bull runs. The reverse, a "death cross," often signals sustained downward pressure.
How to read a basic OHLC chart
OHLC stands for Open, High, Low, and Close. Every candle on a crypto chart represents these four data points over a specific time period. A green candle means price closed higher than it opened. A red candle means it closed lower. The wicks above and below show where price tested but ultimately rejected. Reading these correctly gives you immediate context about who is winning, buyers or sellers, in any given session.
Here is a simple step-by-step approach to reading a new chart:
- Identify the major trend direction on a higher timeframe (weekly or daily).
- Map out key support and resistance levels where price has repeatedly reacted.
- Look for a recognizable chart pattern forming near those levels.
- Confirm with volume and at least one momentum indicator (RSI or MACD).
- Only consider entering when multiple signals align.
Pro Tip: Never rely on a single indicator. A setup confirmed by price action, volume, and two independent indicators is far more reliable than any one signal on its own. This concept, called confluence, is what separates disciplined traders from guessers.
Strengths and weaknesses of technical analysis in crypto
With the tools mapped out, it is time to be honest about where TA performs well and where it falls short. This is the section most traders skip, and it is the reason most traders lose money.
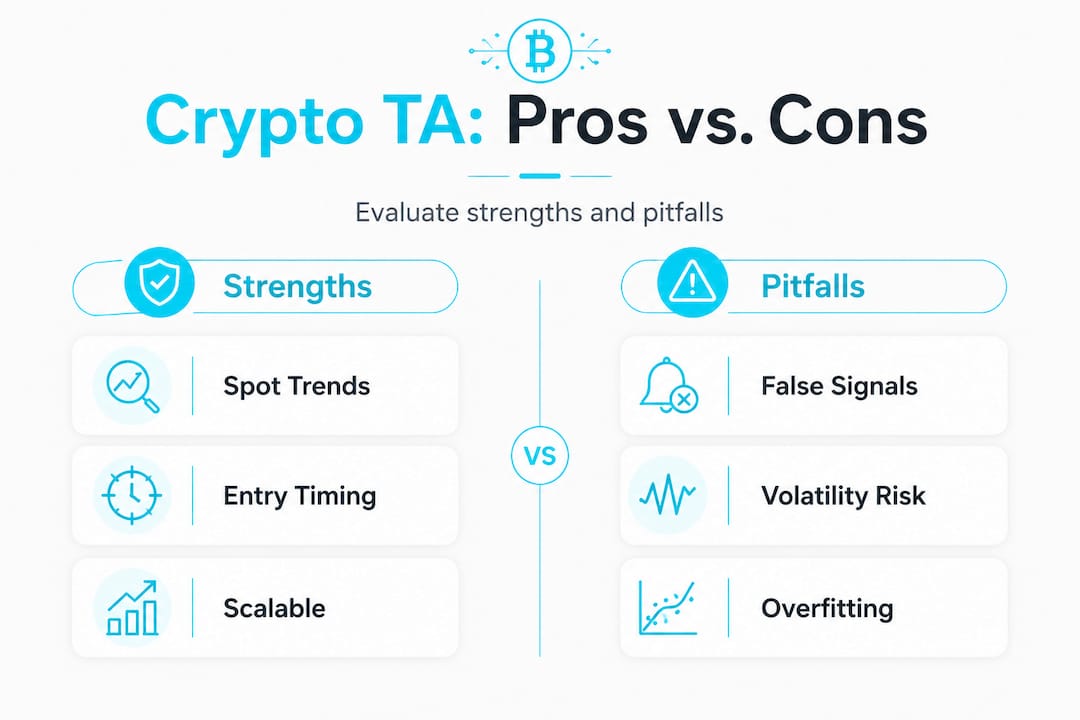
Where technical analysis actually works
Backtested data shows that TA-based strategies can generate meaningful returns. Trend-following strategies like CTREND yield approximately 3.87% weekly, and AI-enhanced models combining LSTM with TA have outperformed buy-and-hold strategies by 65%. Momentum strategies in particular tend to work well in crypto because assets can trend aggressively for weeks or months, giving trend-followers ample opportunity to ride moves.
Here is what TA does well:
- Provides a consistent, repeatable framework for evaluating entries and exits.
- Adapts to any timeframe, from one-minute scalp charts to monthly swing charts.
- Works especially well in trending markets where momentum builds.
- Can be backtested on historical data to validate or discard a strategy.
- Pairs well with risk management tools like stop losses to limit downside.
Where technical analysis breaks down
The same studies that praise TA also contain uncomfortable truths. Some research supports the Efficient Market Hypothesis, which suggests that price patterns are largely random and TA adds no consistent edge. Even within pro-TA research, 95% of active funds underperform simple passive strategies over the long run.
"Technical analysis relies on probabilities, not certainties. Crypto's volatility can cause extended overbought/oversold readings, and false breakouts are common."
Specific weaknesses to watch for:
- Lagging signals: Most indicators are calculated from past data. By the time a signal fires, a large portion of the move may already be over.
- False breakouts: Price breaks a key level, triggers stop losses, then immediately reverses. This is especially common in low-liquidity altcoins.
- Subjectivity: Two traders can look at the same chart and draw different trend lines, support levels, or pattern interpretations.
- Overfitting: A strategy backtested on a specific historical window may fail completely in different market conditions.
Pro Tip: Treat every TA signal as a probability, not a prediction. Your job is not to be right every time. Your job is to find setups where the potential reward justifies the risk, and to execute consistently across many trades.
Pairing TA with proper crypto risk management tips and studying advanced crypto trading practices can significantly reduce the impact of TA's inherent limitations.
Best practices for using technical analysis in crypto trading
Understanding TA's strengths and weaknesses means nothing if you cannot translate that into consistent execution. Here is how to build a practical, reliable TA process.
Step-by-step framework for applied TA
- Start with the higher timeframe. Always anchor your analysis on the daily or weekly chart first to establish the broader trend direction. This acts as your bias filter, telling you whether to look for buys or sells.
- Map key levels. Identify major support and resistance zones. These are the areas where price has historically paused, reversed, or consolidated.
- Drop to your trading timeframe. Once you have context from the higher frame, look for entries on the 4-hour or 1-hour chart to fine-tune timing.
- Apply confluence. Look for at least two or three confirming signals, such as a pattern at a key support level, confirmed by rising volume and an RSI reading that suggests the trend is intact.
- Set your stop loss before entering. Your stop should sit below a logical invalidation point, not at an arbitrary dollar amount. Stop placement below key levels is a core principle of sound risk management.
- Define your target. A minimum 2:1 reward-to-risk ratio means you need to be right only about one-third of the time to be profitable over the long run.
How to combine TA with other research layers
Pure TA is powerful but incomplete. Combining it with on-chain data (wallet activity, exchange flows, miner behavior) and macro fundamentals (rate decisions, regulatory news) gives you much better context. For example, a bullish chart pattern means more when on-chain data shows whale accumulation at the same price level.
Key behaviors to build into your trading routine:
- Backtest strategies on at least 100 historical trades before using real capital.
- Paper trade new setups for two to four weeks to identify flaws without financial cost.
- Keep a trading journal that logs entry rationale, outcome, and what you learned.
- Avoid indicator overload. Three indicators used consistently beat ten indicators applied inconsistently every time.
Studying top crypto trading strategies and understanding trading psychology tips are equally important because the psychological side of trading is where most technically solid strategies collapse. Fear and greed override analysis more often than bad setups do.
Managing risk the right way
Position sizing is the most underrated skill in trading. Many traders obsess over finding the "perfect entry" while ignoring that a single poorly sized trade can wipe out ten winning ones. Understanding crypto risk-reward ratios helps you design trades where you win more per successful trade than you lose per failed one.
Pro Tip: Cap your risk at 1% to 2% of your total portfolio on any single trade. This keeps a losing streak from ending your account and gives your strategy the sample size it needs to show its true edge.
Our perspective: Technical analysis in crypto—what most traders get wrong
Most TA guides focus on showing you more indicators. This one should end with a more honest lesson: the indicator is almost never the problem.
After observing how traders at every level use technical analysis, the pattern is consistent. Beginners think the right indicator will give them certainty. Intermediate traders layer on more tools hoping complexity adds accuracy. Advanced traders eventually strip everything back and focus on structure, discipline, and probability management.
The hard truth is that TA identifies high-probability setups, not certainties. Machine learning models enhance this, but even the most sophisticated AI-driven TA underperforms when the underlying strategy lacks logic or the trader lacks discipline to follow it.
The traders who consistently outperform over years are not the ones with the most complex systems. They are the ones with the simplest systems applied with the most consistency. They define risk before every trade. They do not move stop losses. They do not revenge-trade after a loss. They treat TA as a lens for organizing market information, not a crystal ball that removes uncertainty.
AI tools genuinely help. Pattern recognition at scale, backtesting across thousands of candles in seconds, and real-time signal monitoring all give you an edge you cannot replicate manually. But AI amplifies your framework. If your framework is flawed, AI will only help you execute flawed trades more efficiently.
The shift most traders need to make is from "what signal do I need?" to "what process do I trust?" Build a simple, backtested approach. Add one AI tool that fits your style. Apply it with discipline across many trades. That is what separates traders who survive the volatility of crypto from those who eventually burn out.
Enhance your crypto trading with advanced tools
You now have a solid understanding of technical analysis, from the foundational concepts to the real-world pitfalls and practical execution steps. The next step is putting better tools behind that knowledge.

At Crypto Innovate Labs, we build AI-powered market intelligence specifically for traders who want more than guesswork. Our platform gives you predictive signals, trend monitoring, and pattern detection built on machine learning, so you spend less time staring at charts and more time making confident decisions. Explore our trading methodology to see how our signals are built and validated. When you are ready to go deeper, browse our advanced TA marketplace for premium indicators and curated research tools designed for serious retail traders.
Frequently asked questions
Is technical analysis reliable for crypto trading?
Technical analysis can improve your odds by identifying high-probability setups but is not foolproof and works best when combined with risk management and other analytical tools.
What are the best technical indicators for crypto?
Popular options include Moving Averages, RSI, MACD, and Bollinger Bands; combining several indicators together provides stronger, more reliable signals than relying on any one alone.
Can AI improve technical analysis results in crypto?
Yes, research shows AI models like LSTM paired with TA can beat buy-and-hold strategies significantly, making AI a powerful enhancement layer for traditional technical approaches.
How should I manage risk when trading with technical analysis?
Place stop losses below key levels, keep risk under 2% of your portfolio per trade, and always define your risk before entering a position.
Why does technical analysis fail sometimes in crypto?
TA can break down when indicators lag in volatile conditions, during sudden news-driven moves, or when patterns are applied mechanically without considering broader market context.