
TL;DR:
- Crypto signals often originate from on-chain data, revealing network activity before price moves.
- Combining technical and on-chain indicators enhances trading accuracy and reduces false signals.
- Understanding each indicator's scope and timing is vital for effective crypto trading decisions.
Some of the most powerful signals in crypto never show up on a candlestick chart. They live on the blockchain itself, revealing what wallets are doing, where coins are flowing, and whether the network is heating up or cooling down before price reacts. Most traders are still glued to moving averages and RSI, treating chart patterns as the whole story. But digital currency markets are fundamentally different from traditional assets, and the data that drives them runs deeper than price and volume. This article breaks down what crypto market indicators actually are, how the two main types differ, and how to use them together for sharper, better-timed decisions.
Table of Contents
- What is a crypto market indicator?
- Types of crypto market indicators: Technical vs. on-chain
- Key examples of must-know crypto indicators
- How to combine indicators for better trading signals
- Why most traders misinterpret crypto indicators—and how to avoid their mistakes
- Upgrade your strategy with advanced indicator insights
- Frequently asked questions
Key Takeaways
| Point | Details |
|---|---|
| Technical vs. on-chain | Technical indicators use price data while on-chain indicators leverage blockchain activity for unique insights. |
| Predictive power | On-chain signals often lead market moves, letting you act before price shifts become obvious. |
| Best results | Combining indicator types and volatility filters creates stronger, more reliable trading signals. |
| Common mistakes | Overreliance on one indicator or ignoring signal lag results in costly errors for traders. |
What is a crypto market indicator?
A crypto market indicator is a quantitative metric designed to analyze price behavior, network activity, or market sentiment to help traders make more informed decisions. Think of indicators as instruments on a dashboard. No single gauge tells you everything, but together they give you a clearer picture of where the market might be heading.
Indicators fall into two primary categories:
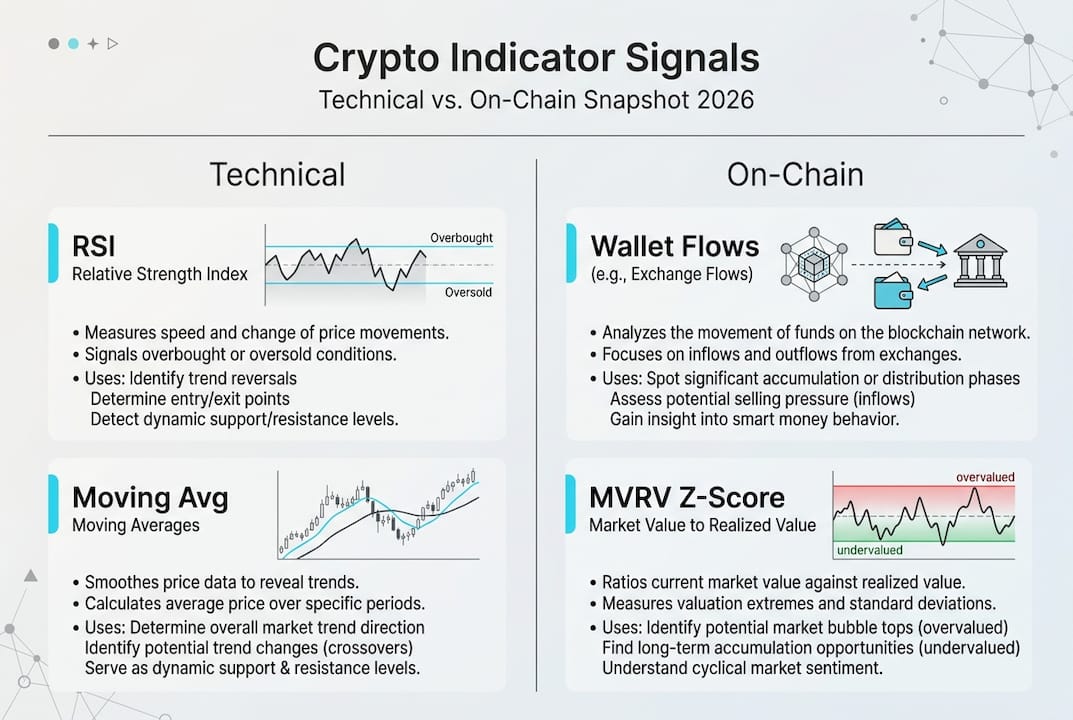
- Technical indicators: Derived from exchange price and volume data. Examples include moving averages, the Relative Strength Index (RSI), and the Moving Average Convergence Divergence (MACD). These tools are widely used across all financial markets.
- On-chain indicators: Pulled directly from blockchain data. They measure things like active wallet addresses, exchange inflows and outflows, realized value, and the Market Value to Realized Value (MVRV) ratio. These metrics reflect actual network behavior, not just market price.
The key difference is the data source. Technical indicators tell you what price has done. On-chain indicators tell you what participants are actually doing with their coins. As research shows, on-chain often leads price because it captures network activity before that activity gets priced in.
| Feature | Technical indicators | On-chain indicators |
|---|---|---|
| Data source | Exchange price and volume | Blockchain transaction data |
| Typical metrics | RSI, MACD, moving averages | MVRV, active addresses, exchange flows |
| Primary use | Trend and momentum analysis | Network behavior and sentiment |
| Signal timing | Often lagging | Can be leading |
| Availability | Any charting platform | Specialized on-chain tools |
Both types have distinct strengths. Technical indicators are easy to access and widely understood. On-chain indicators require more specialized tools but can reveal market shifts that chart patterns miss entirely. Using both gives you a more complete view of risk and opportunity.
Types of crypto market indicators: Technical vs. on-chain
With an understanding of what these indicators are, let's explore how they're categorized and why both types matter for your trading strategy.
Technical indicators are built from price and volume data recorded on exchanges. They are the foundation of most retail trading strategies. Common examples include:
- Moving averages (MA): Smooth out price noise to identify trend direction. The 50-day and 200-day MAs are widely watched for crossover signals.
- RSI (Relative Strength Index): Measures momentum on a 0 to 100 scale. Readings above 70 suggest overbought conditions; below 30 suggests oversold.
- MACD: Tracks the relationship between two exponential moving averages to spot trend changes and momentum shifts.
These tools are fast to apply and work across any market. Their limitation is that they react to price. By definition, they can only confirm what has already started happening.
On-chain indicators operate differently. They pull data directly from the blockchain, reflecting what holders and transactors are actually doing. Key examples include:
- Exchange flows: When large amounts of Bitcoin move onto exchanges, it often signals selling pressure. Outflows suggest accumulation.
- Active addresses: Rising unique active addresses indicate growing network usage, often a bullish signal.
- Realized value: The aggregate cost basis of all coins, calculated from the price at which each coin last moved.
- MVRV ratio: Compares market value to realized value to identify overvaluation or undervaluation.
Research confirms that on-chain data reveals network activity before it gets reflected in market price, giving traders a meaningful timing edge.
"On-chain metrics can signal what the smart money is doing before the chart catches up. That's the edge most retail traders are leaving on the table."
Pro Tip: If exchange outflows are rising while RSI is approaching oversold territory, that confluence is far more actionable than either signal on its own. Neither indicator is telling the full story alone.
On-chain indicators are most valuable during macro trend transitions, such as cycle tops and bottoms, where chart-based signals tend to lag the most. Technical indicators remain useful for short-term entries and exits within an established trend.

Key examples of must-know crypto indicators
Now let's ground this knowledge in specific, actionable tools retailers and traders rely on to navigate real market conditions.
MVRV Z-Score is one of the most historically accurate cycle indicators in crypto. Here's how it works:
- Calculate the market value (current price multiplied by circulating supply).
- Calculate the realized value (aggregate cost basis of all coins in circulation).
- Subtract realized value from market value.
- Divide by the standard deviation of market value.
The resulting Z-Score tells you how far current market value deviates from its historical norm. According to data tracked by analysts, the MVRV Z-Score above 7 has historically signaled major Bitcoin market tops, while readings below 0 have marked major bottoms. This metric correctly identified the 2017 and 2021 cycle peaks, as well as the 2018 and 2022 bear market lows.
Fear and Greed Index aggregates multiple data points into a single 0 to 100 sentiment score:
- Volatility (25%)
- Market momentum and volume (25%)
- Social media sentiment (15%)
- Bitcoin dominance (10%)
- Google Trends data (10%)
- Surveys (15%)
Extreme fear readings below 20 have frequently preceded strong recoveries. Extreme greed above 80 has often preceded corrections. The index is useful as a sentiment filter, though it lags on-chain signals in terms of predictive timing.
| Indicator | Data source | Primary use | Signal type |
|---|---|---|---|
| MVRV Z-Score | On-chain | Cycle top and bottom detection | Leading |
| Fear and Greed Index | Mixed | Sentiment gauge | Lagging/coincident |
| RSI | Price/volume | Overbought or oversold conditions | Lagging |
| Exchange flows | On-chain | Supply pressure detection | Leading |
| Active addresses | On-chain | Network growth and usage | Leading |
How to interpret these readings in practice:
- Check MVRV Z-Score first for macro context. Is the market historically overvalued or undervalued?
- Layer in the Fear and Greed Index to understand current sentiment. Are participants panicking or euphoric?
- Use RSI on your preferred timeframe to identify short-term entry zones.
- Confirm with exchange flow data. Are coins moving onto or off exchanges?
This layered approach gives you both the macro picture and the short-term timing signal before you act.
How to combine indicators for better trading signals
Understanding leading indicators is key, but combining them sharpens your trading edge and reduces costly mistakes.
The core principle is confluence: when multiple independent signals agree, the probability of a reliable trade setup increases. Here's a practical method for pairing technical and on-chain data:
- Start with on-chain context. Check MVRV Z-Score and exchange flows to understand the macro environment. Are coins accumulating or distributing?
- Apply a technical filter. If on-chain suggests accumulation, look for RSI readings below 35 on the daily chart as a potential entry zone.
- Confirm with volume. A volume spike accompanying an RSI bounce adds further weight to the signal.
- Set a volatility filter. Crypto's price swings are extreme compared to traditional markets. Avoid acting on signals during abnormally high volatility unless the confluence is very strong.
- Define your invalidation level. Know in advance what price action or indicator reading would tell you the signal was wrong.
Research supports this approach: combining technical and on-chain data reduces false signals, particularly in crypto's high-volatility environment where single-indicator strategies break down frequently.
Pro Tip: Never act on a single indicator reading in crypto. The market is too volatile and too sentiment-driven for one metric to carry the full weight of a trade decision. Require at least two independent signals to agree before committing capital.
Before acting on any indicator-based signal, run through this quick checklist:
- Does on-chain data support the direction suggested by the technical signal?
- Is the broader market trend aligned with the trade?
- Is volatility elevated or normalized right now?
- Have you defined your exit and invalidation level?
- Are you sizing the position appropriately for the signal strength?
This discipline separates traders who use indicators as a crutch from those who use them as a genuine edge.
Why most traders misinterpret crypto indicators—and how to avoid their mistakes
Here's an uncomfortable truth: most retail traders use indicators incorrectly, not because they don't understand the math, but because they misunderstand the timing. They see an RSI reading below 30 and assume a bounce is guaranteed. They see a bullish MACD crossover and buy without checking whether exchange inflows are spiking at the same time.
Conventional technical-only analysis was built for equity markets with slower information cycles. Crypto moves faster, reacts to sentiment shifts in minutes, and is driven by on-chain dynamics that charts simply cannot capture. Treating crypto like a stock chart is like navigating with an outdated map.
The real edge is not in finding a better indicator. It's in understanding what each indicator actually measures and what it cannot tell you. MVRV Z-Score is powerful for cycle timing but useless for short-term entries. RSI is useful for momentum but blind to what holders are actually doing with their coins. Knowing the boundaries of each tool is what separates disciplined traders from reactive ones.
Confluence is not just a strategy. It's a mindset. Before any trade, ask yourself: what would have to be true across multiple independent data sources for this signal to be valid? If you can't answer that question, you're not ready to act.
Upgrade your strategy with advanced indicator insights
Ready to put advanced crypto indicators to work in your strategy? Understanding the theory is one thing. Having the right tools to monitor MVRV Z-Score, exchange flows, sentiment data, and technical signals in one place is what actually moves the needle on your trading performance.

At Crypto Innovate Labs, our machine learning platform is built to do exactly that. We aggregate on-chain and technical signals, apply AI-driven analysis, and surface predictive market intelligence so you can act with confidence rather than guesswork. Whether you're managing risk at a cycle top or looking for accumulation zones, our advanced crypto trading tools give you the context and clarity serious traders need. Explore the platform and see how smarter indicator analysis can sharpen every decision you make.
Frequently asked questions
What is the difference between technical and on-chain indicators?
Technical indicators use price and volume chart data, while on-chain indicators analyze blockchain activity like wallet flows, active addresses, and realized value. Both serve different purposes and are most powerful when used together.
Is the MVRV Z-Score reliable for predicting crypto cycles?
The MVRV Z-Score above 7 has historically marked Bitcoin cycle tops, and readings below 0 have identified major bottoms, making it one of the most accurate macro cycle tools available to traders.
How can I reduce false trading signals in crypto?
Combining technical and on-chain indicators and applying volatility filters significantly reduces false positives, especially in crypto's fast-moving and sentiment-driven markets.
Why do some indicators seem to lag behind price action?
Most technical indicators are calculated from historical price data, so they confirm moves after they start. On-chain indicators can reveal network-level shifts before price reacts, giving them a meaningful leading edge.