
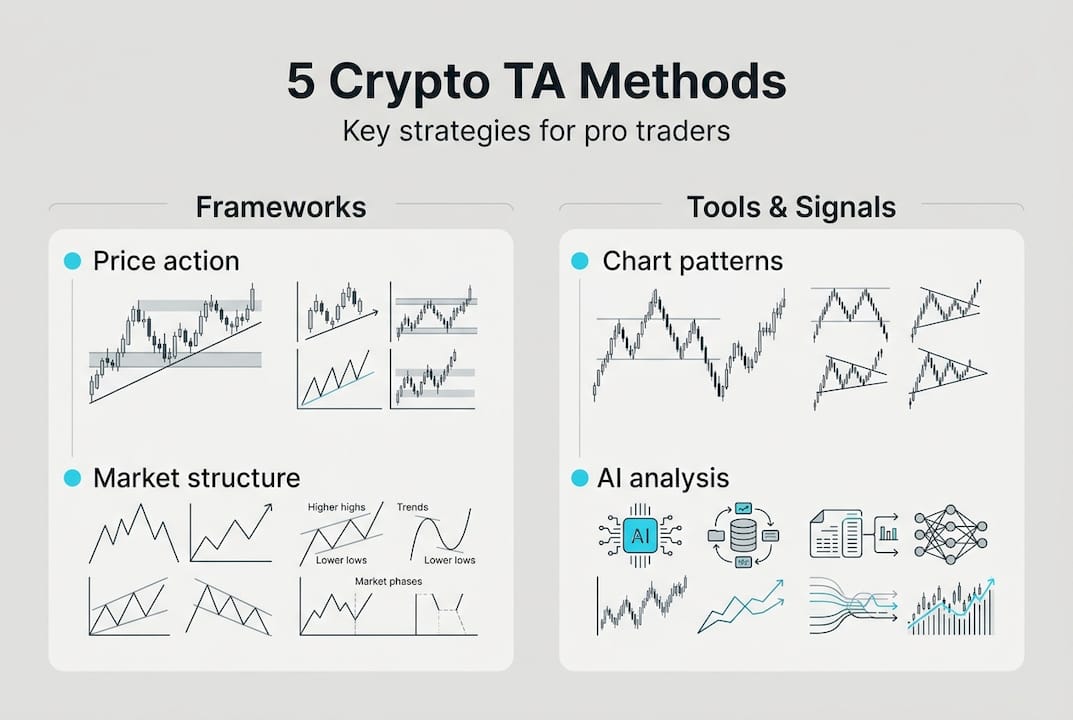
You've done the research, set your entry, and watched the market move against you within minutes. It's a frustrating pattern that even experienced traders know well. The difference between consistently profitable traders and the rest often comes down to methodology, not luck. Crypto TA involves studying historical price, volume, and chart data to forecast movements, and when applied with discipline, it transforms guesswork into a structured decision-making process. This guide covers advanced technical analysis techniques, AI-driven insights, and practical frameworks designed to give you a measurable edge in volatile crypto markets.
Table of Contents
- Why technical analysis is essential in crypto trading
- Essential tools and charting setups for technical analysis
- Foundational TA frameworks: Price action, market structure, and multi-timeframe analysis
- Key indicators and advanced chart patterns: Beyond the basics
- Confluence and real-world risk management: How professionals thrive
- AI-driven insights and backtesting for crypto technical analysis
- Common mistakes, expert tips, and troubleshooting your TA process
- Next steps: Supercharge your trading with advanced resources
- Frequently asked questions
Key Takeaways
| Point | Details |
|---|---|
| Market structure first | Analyze price action and trend structure instead of relying solely on indicators. |
| Combine signals and manage risk | Blend different tools for confirmation and always set clear invalidation points. |
| Test with AI and data | Leverage backtesting and AI tools to verify strategies before live trading. |
| Avoid common TA mistakes | Trade less, focus on probability, and be aware of market regime changes. |
Why technical analysis is essential in crypto trading
Before you can master the advanced techniques, you need to understand why TA is foundational for crypto traders. Unlike stocks, crypto markets run 24 hours a day, 7 days a week, with no circuit breakers and far fewer institutional guardrails. That creates both opportunity and chaos.
Technical analysis gives you a repeatable framework for reading that chaos. Crypto chart analysis uses tools like candlestick charts, support and resistance levels, trend lines, and indicators such as RSI, MACD, and moving averages to identify probable price behavior. These tools don't predict the future, but they do help you define high-probability setups.
Here's what makes TA especially powerful in crypto:
- 24/7 price action means patterns form and break at any hour, rewarding traders who monitor structure continuously
- High volatility amplifies both the clarity and the risk of chart signals
- Thin liquidity on smaller coins makes price manipulation more common, so TA helps you spot abnormal moves
- Retail-driven markets mean sentiment and momentum patterns repeat more predictably than in institutional-heavy equity markets
"The goal of technical analysis is not to predict the future with certainty, but to identify conditions where the probability of a favorable outcome is higher than the risk taken."
Fundamental analysis tells you what to buy. Technical analysis tells you when and how to act on it. In crypto, timing is often the difference between a 30% gain and a 30% loss.
Essential tools and charting setups for technical analysis
Now that you know why TA matters, let's set up your toolkit for implementing these principles effectively. The right setup reduces friction and keeps your focus on analysis, not logistics.
Multi-timeframe TA methods are built on market structure, higher highs and higher lows for uptrends, and lower highs and lower lows for downtrends. Your platform needs to support seamless timeframe switching to apply these methods properly.
Here are the core tools every serious crypto TA trader should have:
- TradingView: Industry-standard charting with custom indicators, alerts, and Pine Script automation
- Cryptowatch: Real-time multi-exchange data aggregation, useful for spotting cross-exchange divergences
- Coinalyze: Funding rates, open interest, and liquidation data for perpetual futures traders
- Glassnode or CryptoQuant: On-chain data feeds that add context to price action
- AI plugins or bots: Tools like Tensorcharts or custom ML models for order flow and pattern recognition
| Tool | Primary use | Approximate monthly cost |
|---|---|---|
| TradingView Pro | Charting and alerts | $15 to $60 |
| Coinalyze | Derivatives data | Free to $30 |
| Glassnode | On-chain analytics | $29 to $799 |
| Cryptowatch | Multi-exchange feeds | Free to $20 |
| Custom AI model | Pattern detection | Varies |
For hardware, a dual-monitor setup is the minimum for serious traders. One screen for macro structure and one for execution timeframes. A stable internet connection and a browser with minimal extensions reduce latency and distraction.
Foundational TA frameworks: Price action, market structure, and multi-timeframe analysis
With tools at hand, it's critical to start with the frameworks that separate successful traders from the rest. Indicators are secondary. Structure is primary.
Market structure analysis defines the trend by tracking higher highs and higher lows in uptrends, and lower highs and lower lows in downtrends. When structure breaks, the trend is potentially reversing. That's your signal to reassess, not double down.
Here's a practical workflow for analyzing any crypto chart:
- Start on the weekly or daily chart to identify the dominant trend and major support/resistance zones
- Drop to the 4-hour chart to find the intermediate structure and confirm trend alignment
- Use the 1-hour chart to identify entry zones, pattern completions, and momentum shifts
- Mark key levels across all timeframes before placing any trade
- Define your invalidation point before entry, the price level where your thesis is wrong
- Execute only when at least two timeframes align on direction and structure
Pro Tip: Never trade a setup you can only see on one timeframe. Multi-timeframe confluence filters out the majority of false signals that trap traders in choppy conditions.
Price action is the cleanest signal available. Candlestick patterns like engulfing bars, pin bars, and inside bars at key structural levels carry far more weight than a single RSI reading. Context is everything.

Key indicators and advanced chart patterns: Beyond the basics
Having the right frameworks is only the start. Now let's focus on which indicators and advanced patterns actually deliver results.
Crypto chart patterns like head and shoulders show roughly 80% success rates in backtests, while wedge patterns come in around 70%. These aren't guarantees, but they're among the most statistically reliable setups available to active traders.
Not all indicators perform equally. Backtesting momentum indicators shows that MACD and RSI underperform in choppy BTC markets, while cointegration-based pairs trading has yielded a 62% total return with a Sharpe ratio of 0.93 in structured tests.
| Indicator or pattern | Best market condition | Approximate reliability |
|---|---|---|
| Head and shoulders | Trending reversal | ~80% |
| Wedge patterns | Consolidation breakout | ~70% |
| RSI divergence | Trend exhaustion | Moderate |
| MACD crossover | Strong trending markets | Low in ranging markets |
| Fibonacci retracement | Pullback entries | Context-dependent |
| Wyckoff phases | Accumulation/distribution | High with volume confirmation |
Fibonacci retracements work best when combined with structural levels. The 0.618 and 0.786 retracement zones are particularly powerful when they align with prior support or resistance. Wyckoff phase analysis adds a layer of institutional intent reading that pure indicator traders miss entirely.
The key takeaway: use indicators to confirm what structure already suggests, not to generate signals independently.
Confluence and real-world risk management: How professionals thrive
To move from chart reading to real-world profit, it's essential to blend signals and manage risk like a professional.
Trading confluence strategies combine multiple inputs to build signal strength. In perpetual futures markets especially, single indicators fail because leverage and funding rates distort price behavior in ways that standard TA doesn't account for.
Here's what a professional confluence checklist looks like:
- Market structure: Is the trend intact on higher timeframes?
- Funding rate: Is it extreme positive or negative, signaling potential reversal?
- Open interest: Is it rising with price (healthy trend) or diverging (warning sign)?
- Sentiment data: Are retail traders overwhelmingly positioned one way?
- Volume profile: Is price trading at high-value or low-value areas?
"Technical analysis doesn't predict markets. It manages uncertainty by defining the conditions under which you're willing to take risk."
Risk management is not optional. Define your invalidation point before every trade. Size your position so that hitting that invalidation costs you no more than 1 to 2% of your total capital. This keeps you in the game long enough for your edge to play out.
Pro Tip: When the market is in a choppy, low-volatility range with no clear structure, the best trade is often no trade. Overtrading in low-conviction conditions is one of the fastest ways to erode a profitable edge.
AI-driven insights and backtesting for crypto technical analysis
Advanced confluence strategies are strongest when backed by unbiased data and AI. Here's how to integrate them.
AI and machine learning tools can detect non-obvious correlations in price, volume, and order flow data that human eyes miss. Pattern recognition models trained on years of crypto data can flag setups before they become obvious on a standard chart. This is where platforms like Crypto Innovate Labs add real value to your process.
Crypto strategy backtesting shows that larger-cap assets like BTC and ETH historically outperform smaller coins on risk-adjusted return metrics. Momentum strategies work well in trending conditions but break down in ranging markets, making regime filters essential.
Here's a step-by-step backtesting workflow:
- Define your strategy rules precisely, entry, exit, stop, and position size
- Select a representative data set covering both trending and ranging market conditions
- Include all costs: trading fees, slippage, and funding rates for futures
- Run walk-forward testing to avoid curve-fitting to historical data
- Evaluate by Sharpe ratio and max drawdown, not just total return
| Metric | What it measures | Target benchmark |
|---|---|---|
| Sharpe ratio | Risk-adjusted return | Above 1.0 |
| Max drawdown | Worst peak-to-trough loss | Below 20% |
| Win rate | Percentage of profitable trades | 45% or higher with good R:R |
| Profit factor | Gross profit divided by gross loss | Above 1.5 |
Simple strategies often outperform complex ones in live markets. The edge comes from discipline and execution, not from stacking 12 indicators on a chart.
Common mistakes, expert tips, and troubleshooting your TA process
Even with the best tools and analysis, mistakes happen. Here's how to avoid and recover from them.
Crypto TA must account for 24/7 volatility and leverage traps that don't exist in traditional markets. Professional traders trade less, not more, and focus on probability management over prediction.
The most common mistakes active traders make:
- Indicator stacking: Adding more indicators doesn't add clarity. It adds noise and conflicting signals.
- Ignoring higher timeframe structure: Entering a trade on the 5-minute chart against the daily trend is a low-probability bet.
- Moving stop losses: Widening your stop after entry is not risk management. It's hope management.
- Revenge trading: Trying to recover losses immediately after a bad trade leads to compounding errors.
- Skipping the invalidation point: If you don't know where you're wrong, you don't have a trade. You have a gamble.
Pro Tip: After any losing streak of three or more trades, step away from the screen for at least 24 hours. Review your trade log, not the charts. The problem is almost always process, not market conditions.
When your analysis consistently fails, the issue is usually one of three things: you're trading the wrong market regime, your timeframe is misaligned with your strategy, or you're letting emotion override your rules. Each has a specific fix, and none of them involve adding more indicators.
Next steps: Supercharge your trading with advanced resources
Ready to take your technical analysis further? The frameworks in this guide give you a strong foundation, but applying them consistently in live markets requires ongoing refinement and access to the right data.
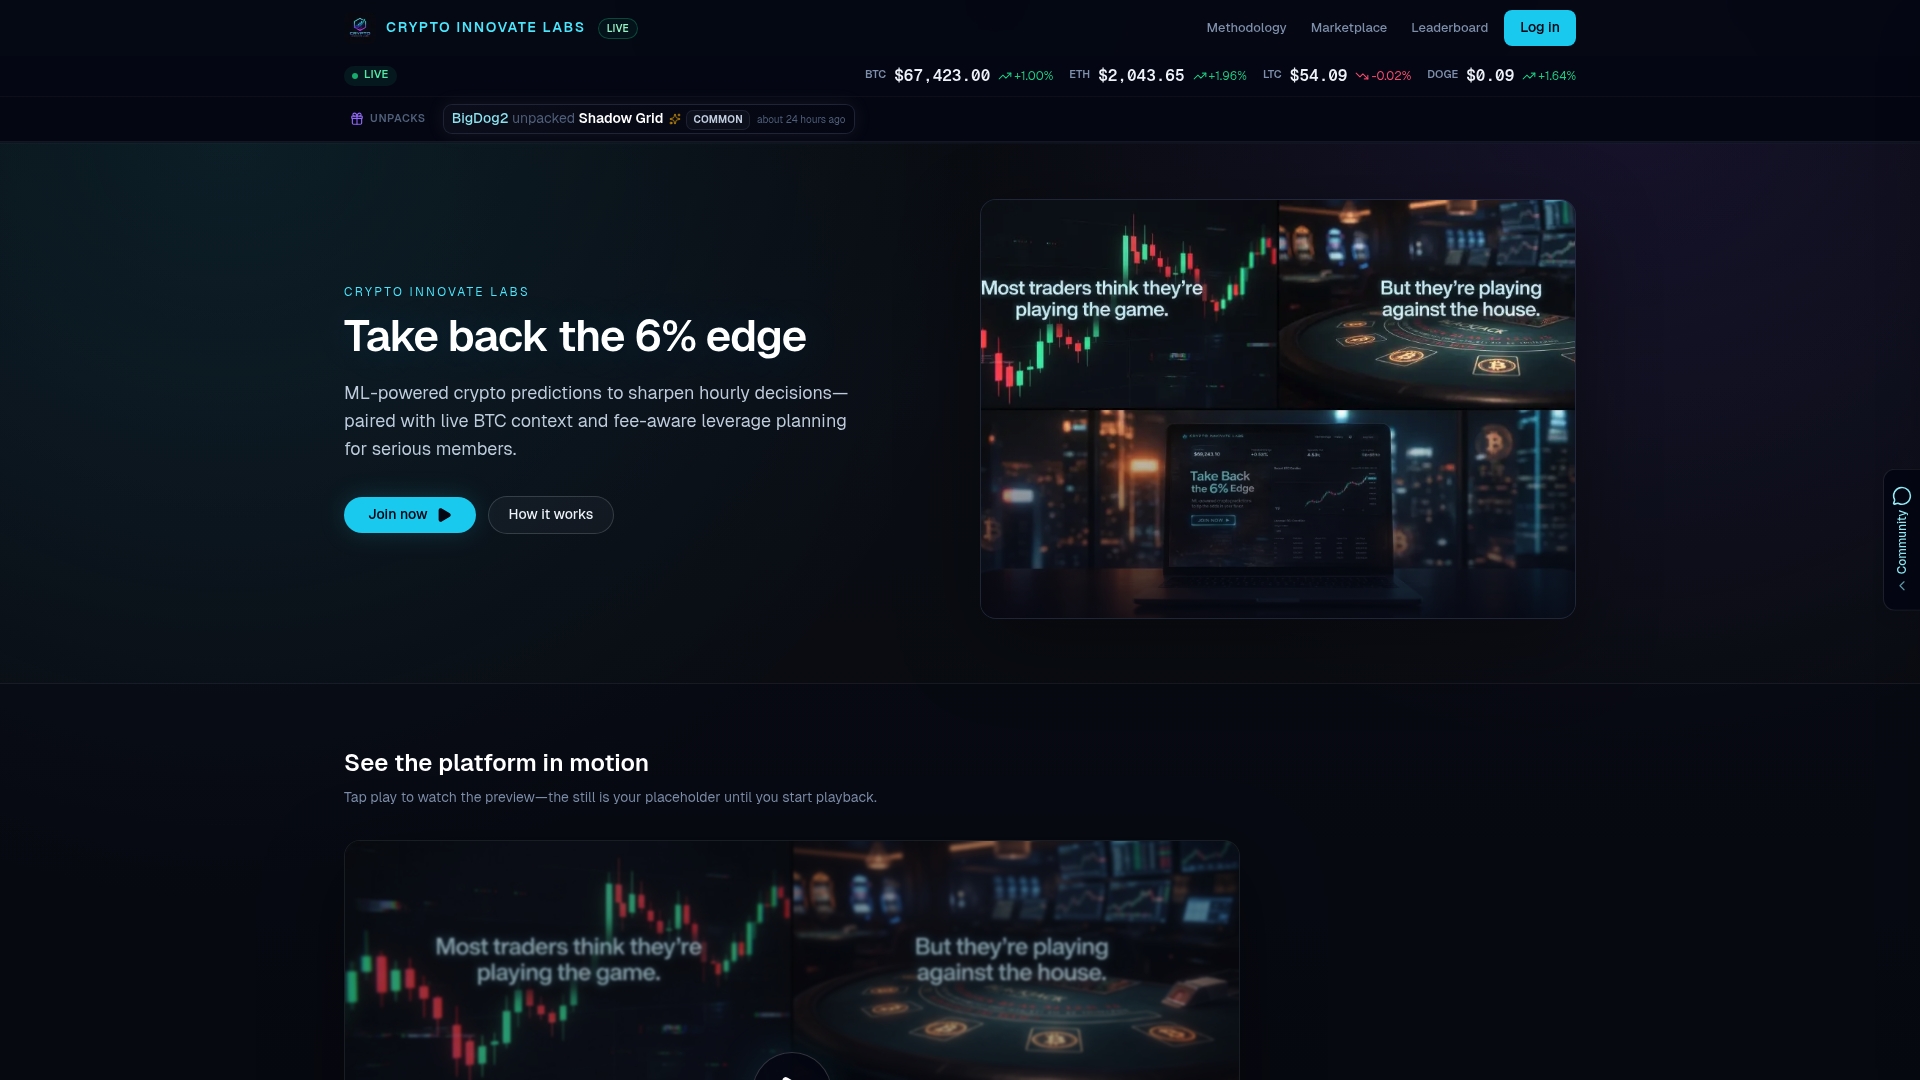
Crypto Innovate Labs is built specifically for traders who want more than basic charting. Our machine learning platform delivers AI-driven market signals, predictive analytics, and real-time trend monitoring across major crypto assets. Whether you're refining your confluence strategy, running backtests, or tracking on-chain data, our tools are designed to support every layer of your analysis process. Join traders who are already using smarter data to make more informed decisions. Visit Crypto Innovate Labs and see how AI-powered intelligence can sharpen your edge in any market condition.
Frequently asked questions
What are the most reliable chart patterns in crypto technical analysis?
Head and shoulders and wedge patterns show around 70 to 80% success rates in crypto backtests, making them among the most trusted setups for active traders who combine them with volume confirmation.
How does technical analysis differ in crypto vs. stocks?
Crypto TA must account for 24/7 markets, extreme volatility, and unique liquidity dynamics. Stock TA relies more on regular market hours, institutional order flow, and traditional economic data that simply doesn't apply to digital assets.
Can you automate technical analysis and trading with AI?
Yes. AI can identify patterns, optimize entries, and execute trades automatically, but robust backtesting and strict risk management protocols remain essential before deploying any automated strategy in live markets.
Why do some indicators underperform in crypto?
Momentum indicators like MACD and RSI generate frequent false signals in ranging or choppy crypto markets. They perform significantly better when the market is in a clear, sustained trend with strong directional momentum.