
TL;DR:
- Crypto correlations are dynamic and can change rapidly based on market conditions and events.
- Traders should treat correlation as a living metric, regularly updating their data and analysis.
- Using correlation insights enhances risk management, diversification, and timing in crypto trading strategies.
Most traders assume crypto assets either move in perfect lockstep with Bitcoin or operate as completely independent islands. Neither is true. Crypto correlation is the statistical measure of how price movements across different cryptocurrencies relate to each other, and it shifts constantly based on market conditions, liquidity, and macro events. Traders who treat correlation as a fixed rule get caught off guard when relationships break down. Those who understand its dynamic nature use it to manage risk, spot diversification windows, and time trades with far greater precision. This guide walks you through everything from the basics to real trading applications.
Table of Contents
- What is market correlation in crypto?
- Why crypto correlations shift: Factors and real examples
- Crypto vs. traditional finance: Systemic risk and diversification
- Turning correlation insights into actionable trading strategies
- Why most traders underestimate crypto correlations and what you should do instead
- Take your crypto trading further with Crypto Innovate Labs
- Frequently asked questions
Key Takeaways
| Point | Details |
|---|---|
| Correlation basics | Market correlation tells you how closely crypto assets move together, measured from -1 to +1. |
| Why correlations change | Crypto correlations shift with market conditions, often spiking in times of stress or when BTC moves sharply. |
| Systemic risk limits | Despite internal links, crypto rarely moves perfectly with stocks—giving you diversified opportunities. |
| Actionable strategies | Savvy traders use live correlation data to diversify portfolios and make smarter trading decisions. |
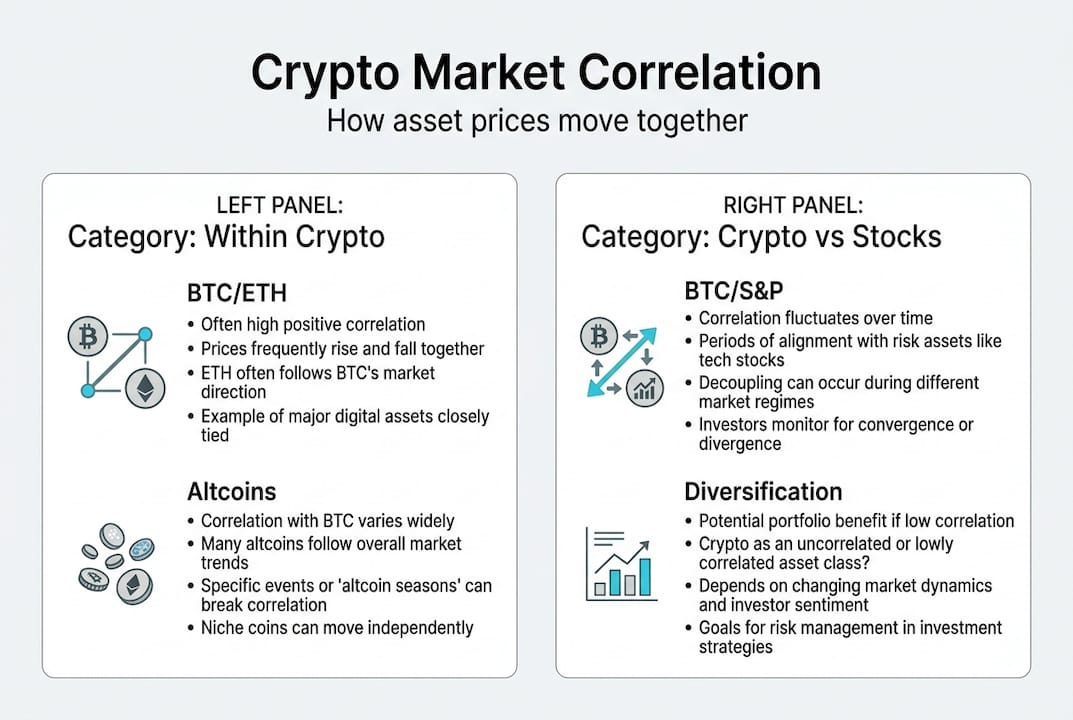
What is market correlation in crypto?
Correlation, in the simplest terms, tells you how closely two assets move together. In crypto, this is typically quantified using the Pearson correlation coefficient, a number that runs from -1 to +1. A value of +1 means two assets move in perfect sync. A value of -1 means they move in exact opposite directions. Zero means no relationship at all.
Here is a snapshot of typical correlation ranges across major crypto pairs based on historical data:
| Asset pair | Typical correlation range | Relationship type |
|---|---|---|
| BTC / ETH | 0.75 to 0.90 | Strong positive |
| Altcoins / BTC | 0.60 to 0.85 | Moderate to strong positive |
| Memecoins / BTC | 0.50 to 0.80 | Moderate positive |
| BTC / Gold | 0.10 to 0.35 | Weak positive |
| BTC / S&P 500 | 0.20 to 0.45 | Weak to moderate positive |
These numbers are not static. They represent averages across different market phases and can change dramatically within weeks.
Understanding what these values mean in practice matters more than memorizing the scale. A 0.85 correlation between BTC and ETH means that when Bitcoin drops 10%, Ethereum is very likely to follow. A 0.55 correlation between a memecoin and BTC suggests some shared movement, but also meaningful independence.
- Positive correlation (above 0.6): Assets tend to rise and fall together, reducing diversification benefit
- Neutral correlation (0.2 to 0.5): Some shared movement, but enough independence to offer partial diversification
- Negative or near-zero correlation (below 0.2): Assets move independently, offering genuine diversification potential
Pro Tip: Relying on gut feeling about how two assets relate is one of the most common mistakes traders make. Two assets can look correlated for months and then diverge sharply during a news event or liquidity crunch. Always verify with actual coefficient data before building a thesis around correlation.
Why crypto correlations shift: Factors and real examples
Defining correlation is just the first step. Understanding why these relationships are never fixed helps traders anticipate market shifts before they happen.
Correlations in crypto are not stable because the market itself is not stable. Several key forces drive correlation changes:
- Market regime: In calm, trending bull markets, correlations between BTC and altcoins tend to loosen. In bear markets or crashes, they tighten sharply as traders sell everything at once.
- Liquidity conditions: When liquidity dries up, assets that normally move independently start correlating because forced selling hits all markets simultaneously.
- News and catalysts: Regulatory announcements, exchange collapses, or macro shocks can instantly reset correlation relationships that took months to form.
- Investor behavior: Retail-driven markets tend to show higher correlation because sentiment drives broad buying and selling across the board.
The 2022 crypto crash is the clearest recent example. When Terra/LUNA collapsed and the FTX crisis followed, BTC-ETH correlation spiked toward the high end of its 0.75 to 0.90 range, and altcoins that had been showing moderate independence suddenly moved almost in lockstep with Bitcoin. Memecoins, which typically show correlations of 0.50 to 0.80 with BTC, surged toward the upper bound as panic selling dominated.
"Crypto correlations are dynamic and non-stationary, often converging to 1 in stress periods, with BTC leading price transmission across the market."
Post-COVID recovery in 2020 and 2021 showed the opposite pattern. As institutional money flowed in and sentiment was broadly positive, BTC and ETH maintained strong correlation while some DeFi tokens and niche altcoins began to diverge, offering real diversification windows for traders paying attention.

The takeaway is that even strong historical correlations can break down abruptly. A correlation of 0.85 measured over 12 months tells you very little about what will happen next week during a market shock. Treating past correlation as a guaranteed future relationship is a trap that catches even experienced traders.
Crypto vs. traditional finance: Systemic risk and diversification
Recognizing crypto's unique drivers, it's just as crucial to compare how these correlations differ from traditional finance and what that means for your portfolio management.
Crypto's internal correlations are high. Most major tokens move together, especially during stress. But crypto's relationship with traditional finance assets like stocks, bonds, and commodities is a different story. Research shows that crypto shows limited spillovers to traditional financial markets under normal conditions, which historically made it an attractive diversifier for portfolios heavy in equities. However, institutionalization through Bitcoin ETFs and growing hedge fund participation is gradually tightening those links.
| Risk dimension | Crypto markets | Traditional finance |
|---|---|---|
| Internal correlation | Very high (0.60 to 0.90) | Moderate (varies by sector) |
| Systemic spillover to other asset classes | Low to moderate | High (interconnected globally) |
| Correlation during market stress | Surges toward 1 | Varies, but also rises |
| Impact of institutionalization | Increasing TradFi linkage | Already deeply embedded |
For crypto risk management, understanding this distinction is critical. Here is a practical framework for using correlation data in your risk strategy:
- Map your current portfolio correlations using 30, 60, and 90-day rolling windows to see how relationships are trending, not just where they sit today.
- Identify concentration risk by flagging any cluster of assets with correlations above 0.75. High concentration means a single market shock can hit your entire portfolio at once.
- Introduce low-correlation assets deliberately, not randomly. Check actual coefficient data before assuming a new token adds diversification.
- Monitor macro triggers like Fed rate decisions, regulatory news, and major exchange events that historically spike crypto-to-TradFi correlation.
- Reassess your crypto risk-reward ratios whenever correlation patterns shift significantly, because a strategy built on one correlation environment may not hold in another.
Pro Tip: As Bitcoin ETFs attract more institutional capital, watch for real-time crypto data showing tighter BTC-to-S&P 500 correlation during equity selloffs. This is a structural shift, not a temporary blip, and it changes how you should think about crypto as a portfolio hedge.
Turning correlation insights into actionable trading strategies
All this knowledge becomes most valuable when you can put it to work. Smart traders are already using correlation insights to refine their strategies and protect their capital.
The most direct application is portfolio construction. If your portfolio holds BTC, ETH, and three altcoins that all carry correlations above 0.80 with Bitcoin, you effectively have one concentrated bet dressed up as five positions. True diversification requires deliberately selecting assets with lower correlation coefficients, especially during calm market regimes when diversification opportunities are most available.
Here are the core tactics traders use to turn correlation data into an edge:
- Pairs trading: Identify two historically correlated assets that have temporarily diverged. Go long on the underperformer and short on the outperformer, betting on mean reversion. This is a market-neutral strategy that profits from the relationship itself rather than overall market direction.
- Contagion risk assessment: Before a major market event, check which assets in your portfolio carry the highest correlation to the most vulnerable token. If one collapses, high-correlation neighbors will follow fast.
- Regime-based allocation: In calm markets, lean into lower-correlation altcoins for higher upside. In stressed markets, consolidate into fewer, more predictable assets and reduce exposure to high-correlation clusters.
- Entry and exit timing: When BTC correlation with altcoins starts rising sharply, it often signals a market-wide move is coming. Use this as an early warning signal to tighten stops or reduce position sizes.
- Sector rotation: Crypto sectors like DeFi, layer-2 networks, and AI tokens sometimes show lower correlation with BTC than general altcoins. Rotating into uncorrelated sectors can improve risk-adjusted returns.
Pro Tip: Static correlation tables are not enough for fast-moving crypto markets. Use real-time correlation dashboards that update on rolling windows so you can see when relationships are breaking down before the price action confirms it. Pair this with predictive trading analysis to stay ahead of regime shifts.
For traders looking to build on these fundamentals, advanced crypto trading practices and top trading strategies can help you integrate correlation analysis into a complete system rather than using it in isolation.
Why most traders underestimate crypto correlations and what you should do instead
Here is the uncomfortable reality: even experienced traders use correlation data badly. The most common mistake is treating a correlation calculated over the past year as a reliable guide for the next month. Markets evolve. Narratives shift. Liquidity conditions change overnight.
We see this pattern repeatedly. A trader builds a diversified portfolio based on six-month correlation data, feels confident in the spread, and then watches every position drop simultaneously when a macro shock hits. The correlation they measured was real. It just wasn't current.
The traders who actually gain an edge from correlation analysis are the ones who treat it as a living metric, not a fixed fact. That means recalculating on shorter rolling windows during volatile periods, watching for early signs of correlation convergence before a crisis fully develops, and being willing to restructure a portfolio when the data changes rather than defending a thesis built on old numbers.
Memecoins are a perfect recent example. Their correlation to BTC can sit at 0.55 for months, suggesting meaningful independence. Then during a sharp market selloff, that number surges toward 0.85 within days as retail panic selling dominates. Traders who had built a diversification thesis around memecoins get burned because they were not monitoring the shift in real time.
Adopting advanced trading practices means building correlation monitoring into your regular workflow, not just your initial research. Adaptability is the real edge here.
Take your crypto trading further with Crypto Innovate Labs
Understanding correlation at this level requires more than spreadsheets and static charts. You need tools that update in real time and surface the signals that matter before the market moves.

At Crypto Innovate Labs, our machine learning platform is built specifically for traders who want to act on correlation data, not just read about it. From live correlation tracking across hundreds of token pairs to AI-driven signals that flag regime shifts early, our trading methodology is designed to give you a structural edge in dynamic markets. Explore our crypto analytics marketplace to find the tools that fit your strategy and start putting correlation intelligence to work in every trade you make.
Frequently asked questions
How is market correlation in crypto measured?
Market correlation in crypto is typically measured using the Pearson correlation coefficient, a value ranging from -1 to +1, where +1 indicates perfect positive correlation and -1 indicates perfect inverse movement.
Why do correlations between cryptocurrencies change so much?
Correlations shift because of market stress, liquidity changes, and major news events. Research confirms that crypto correlations are dynamic and non-stationary, often spiking toward 1 during crashes or global shocks.
Does crypto move in sync with the stock market?
Crypto is highly correlated internally but generally shows limited spillovers to TradFi under normal conditions, though growing institutionalization is gradually tightening those connections.
How can you use correlation data in crypto trading?
Correlation data helps you build diversified portfolios, identify contagion risk before it spreads, and time entries and exits more effectively by spotting early signs of regime shifts.