Most crypto traders focus on price. They watch candles, track moving averages, and set alerts for key levels. But the order book sitting right beneath that price chart? It gets ignored. That's a costly mistake. Market depth in crypto refers to the volume of buy and sell orders at various price levels, and it tells you something price alone never can: how much buying or selling pressure exists at each level, and what your trade will actually cost to execute. This guide breaks down how to read depth data, spot manipulation, and use it to make sharper trading decisions.
Table of Contents
- What is market depth in crypto?
- How market depth works: Orders, charts, and slippage
- Key market depth metrics every trader should know
- Manipulation and hidden risks: Spoofing, fake walls, and temporal traps
- Market depth vs. liquidity: How they differ (and why it matters)
- Applying market depth data: Practical trading strategies
- Enhance your trading with advanced crypto tools
- Frequently asked questions
Key Takeaways
| Point | Details |
|---|---|
| What market depth is | Market depth shows how much you can buy or sell at every price based on current order book volume. |
| Why depth matters | Trading against a deep book means better fills and less slippage, while thin books raise your trading risk. |
| Hidden order book risks | Fake walls and spoofing can make books look robust—learn to spot manipulation before you trade. |
| Depth vs. liquidity | Depth is not the same as liquidity; you need both for safe and efficient trading, especially with larger orders. |
| Trader strategies | Analyze depth charts, identify peak liquidity windows, and use the right tools for smarter, lower-impact trades. |
What is market depth in crypto?
Market depth is the full picture of supply and demand sitting in an exchange's order book at any given moment. It shows you every pending buy order (bid) and every pending sell order (ask), organized by price level. The more volume stacked at each level, the deeper the book.
Crypto order books are live, constantly updating records of trader intent. When you place a limit order, you're adding to that depth. When you place a market order, you're consuming it.
Here's a quick glossary to keep things clear:
- Order book: The full list of open buy and sell orders on an exchange
- Bid: A buy order placed below the current market price
- Ask: A sell order placed above the current market price
- Slippage: The difference between your expected price and the actual fill price
- Depth chart: A visual representation of cumulative bid and ask volume across price levels
"Market depth in crypto refers to the volume of buy and sell orders at various price levels in an exchange's order book, indicating liquidity and potential price impact of trades."
A deeper book means larger trades can execute without dramatically moving the price. A thin book means even a modest order can cause sharp price swings. That distinction matters enormously when you're sizing into a position.
How market depth works: Orders, charts, and slippage
Not all market data is created equal. There's a meaningful difference between Level 1 and Level 2 data. Order book levels break down as follows: Level 1 shows only the best bid and ask (the top of the book), while Level 2 reveals the full depth, every price tier with its associated volume.
Most retail platforms default to Level 1. If you're trading any meaningful size, you need Level 2.
The depth chart visualizes this data. The x-axis represents price, and the y-axis shows cumulative order volume. The two curves (bids on the left, asks on the right) slope away from the mid-price. A steep curve means volume drops off fast. A gradual slope means deep, sustained liquidity.

Here's how slippage plays out in practice:
| Scenario | Book type | Price impact on 10 BTC buy |
|---|---|---|
| Thin market | Few orders near mid-price | Price jumps sharply, high slippage |
| Deep market | Heavy volume near mid-price | Minimal price movement, low slippage |
When you place a market order, it fills sequentially from best prices. In a thin book, buying 10 BTC might consume the top five ask levels and push the price up 2% before your order completes. In a deep book, the same order barely registers.
Here's a simple process to evaluate depth before placing a large order:
- Open the Level 2 order book on your exchange
- Identify the mid-price and note the spread
- Scan the ask side for your target buy size
- Calculate how many price levels your order will consume
- Estimate the average fill price vs. the current best ask
That five-step check takes under two minutes and can save you real money.
Key market depth metrics every trader should know
Raw order book data is noisy. Pros filter it through specific metrics that give a cleaner read on actual conditions.
Depth at N% measures the total volume available within a certain percentage of the mid-price. For example, depth at 0.1% and 1% from mid-price are standard benchmarks. Tighter windows reveal how much true liquidity exists right around the current price.
Bid-ask spread is the gap between the best bid and best ask. Tight spreads signal a healthy, competitive market. Wide spreads mean fewer participants and higher execution costs.
Order book imbalance compares total bid volume to total ask volume within a defined range. A heavy bid side suggests buying pressure. A heavy ask side suggests sellers are in control.
Here's how BTC depth looks across major exchanges:
| Exchange | Depth at ±0.1% (approx.) | Notes |
|---|---|---|
| MEXC | ~$80M (BTCUSDT) | Highest reported depth at tight range |
| Major exchanges avg. | $3.86M at 10bps (11:00 UTC peak) | Varies significantly by time |
| Within ±1% range | ~$16.5M | Broader but still meaningful |
Pro Tip: Always check depth at the specific percentage range that matches your expected slippage tolerance. If you can absorb 0.5% slippage, look at depth within that window, not the full book.
- Depth at 0.1% is the tightest, most relevant metric for precision entries
- Bid-ask spread widens during low-volume hours and on smaller exchanges
- Order book imbalance can shift within seconds during volatile periods
- Slippage estimates from depth tables are more reliable than exchange-quoted fees
Manipulation and hidden risks: Spoofing, fake walls, and temporal traps
Here's where market depth gets dangerous for traders who take it at face value. The order book is not always honest.
Spoofing is the practice of placing large orders with no intention of filling them. The goal is to create a false impression of supply or demand, nudging other traders to react. 60 to 70% of large orders in crypto never fill. They're placed and canceled within seconds.
Fake walls are a specific form of spoofing. A large bid wall at a key support level looks like strong buying interest. Retail traders see it and feel confident. Then the wall disappears the moment price approaches it.
"Spoofing and layering involve placing and canceling large orders to manufacture the appearance of depth. These tactics are common in crypto and can mislead even experienced traders."
How to spot manipulation:
- Watch for orders that appear and vanish rapidly without filling
- Use heatmaps to track order persistence over time
- High cancel rates on large orders are a red flag
- Look for order book manipulation patterns like stacked orders at round numbers
Iceberg orders add another layer of complexity. These are large orders that only show a fraction of their true size. The visible portion fills, then more volume appears. You can't see the full iceberg from the surface.
Pro Tip: Never trust a single depth snapshot. Depth varies significantly by time of day, with peaks around 11:00 UTC and troughs near 21:00 UTC. A book that looks deep at noon may be thin by evening.
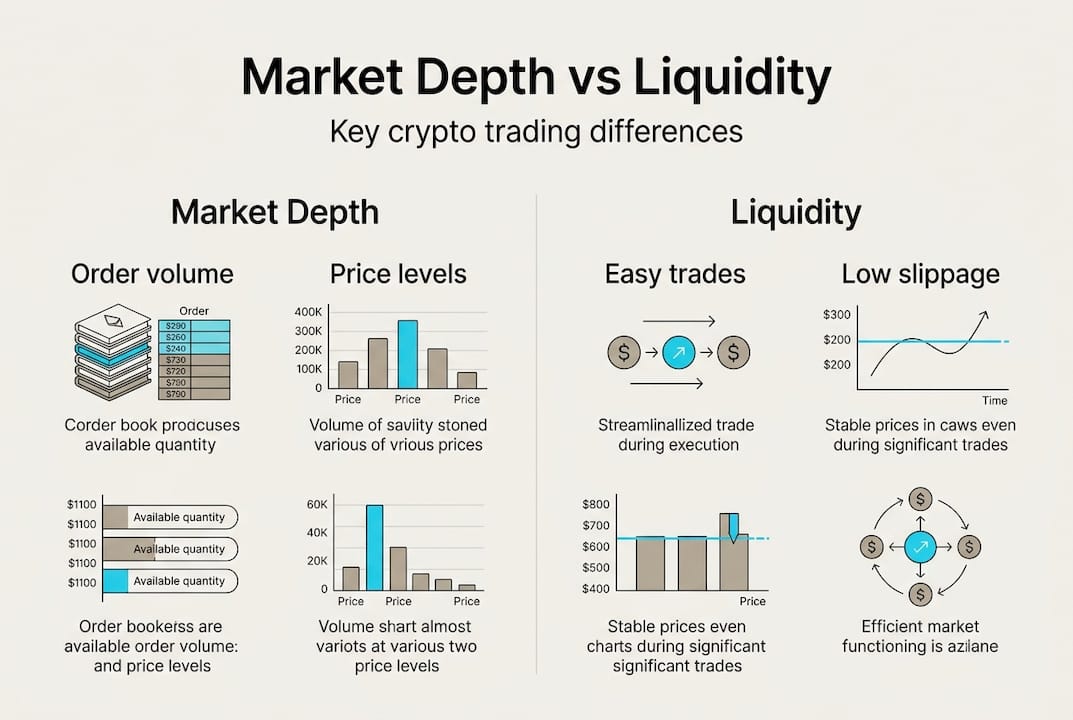
Market depth vs. liquidity: How they differ (and why it matters)
These two terms get used interchangeably, but they measure different things. Conflating them leads to bad decisions.
Liquidity measures how easily you can enter or exit a position without significantly affecting price. It's a broader concept that includes trading volume, market participation, and execution efficiency.
Market depth is more specific. It shows the volume of orders waiting at each price level right now. A coin can have high trading volume (appearing liquid) but a thin order book if most of that volume comes from market orders rather than resting limit orders.
| Factor | Market depth | Liquidity |
|---|---|---|
| What it measures | Volume at each price level | Ease of entry and exit |
| Time sensitivity | Snapshot, changes constantly | Broader, more stable metric |
| Risk if ignored | Slippage on large orders | Poor execution, wide spreads |
Temporal variance in depth can reach 87%, meaning the book you see at one hour may look completely different two hours later. That's not a liquidity shift. It's a depth shift.
BTC remains the most liquid crypto asset, and Binance consistently shows the deepest order books. But even BTC depth fluctuates. Small-cap tokens can show surprising liquidity metrics while having dangerously thin books.
- Deep book does not always equal liquid market
- Liquid market does not always mean deep book
- Use both metrics together for a complete picture
- Always check depth for the specific pair and exchange you're trading on
Applying market depth data: Practical trading strategies
Theory only matters if it changes how you trade. Here's how to put depth data to work.
Check depth charts and order book imbalance before placing any large order. This is non-negotiable. Skipping this step is how traders get surprised by slippage on coins they assumed were liquid.
Here's a practical pre-trade checklist:
- Pull up the Level 2 order book for your target pair
- Check the bid-ask spread and compare it to your expected entry
- Scan for large orders that look suspicious (round numbers, sudden appearance)
- Identify the depth at your slippage tolerance range
- Time your entry for peak liquidity windows, ideally around 11:00 UTC for BTC
- For large orders, consider splitting into smaller chunks to reduce market impact
Pro Tip: Use market making strategies as a reference for understanding how professionals manage order flow. Even if you're not a market maker, knowing how they think helps you anticipate where depth will be strongest.
Heatmaps are one of the most underused tools in a trader's kit. They show order book activity over time, making it easy to spot spoofing patterns and identify genuine support and resistance zones. Multi-exchange aggregators give you a consolidated view of depth across platforms, which is especially useful for larger trades where you might route across venues.
Choose your trading pairs based on depth, not just volume. A pair with $500M in daily volume but a thin book is riskier for execution than a pair with $100M in volume and a consistently deep book.
Enhance your trading with advanced crypto tools
Understanding market depth is one thing. Having the tools to act on it in real time is another. At Crypto Innovate Labs, our machine learning platform is built to give traders exactly that edge.
Our platform aggregates real-time order book data, flags potential spoofing activity, and delivers AI-driven signals that factor in depth conditions alongside price action. Whether you're sizing into a major BTC position or evaluating a smaller altcoin, you need more than a price chart. Explore advanced trading tools that bring market depth analytics, liquidity monitoring, and predictive signals into one place. Smarter execution starts with smarter data.
Frequently asked questions
What does a deep vs. thin order book mean in crypto?
A deep order book has substantial buy and sell orders stacked at multiple price levels, allowing large trades to execute with minimal price movement. A thin book causes high slippage because fewer orders exist to absorb incoming market orders.
How do spoofing and fake walls affect crypto market depth?
Spoofing creates a false impression of depth by placing large orders that are quickly canceled. Since 60 to 70% of large orders never fill, relying on visible order size alone can lead to poor trade execution.
When is crypto market depth usually highest?
Depth peaks around 11:00 UTC and drops to its lowest near 21:00 UTC, following global trading session overlaps and volume patterns.
Is market depth the same as liquidity?
No. Depth reveals supply and demand at specific price levels, while liquidity measures how easily you can trade without affecting price. Both matter, but they can diverge significantly.
How can I use market depth to reduce slippage?
Check depth charts before large orders to identify price zones with heavy volume, then split your trade across those levels to minimize the average fill price deviation.